 |
Slide 2 of 10 |  |

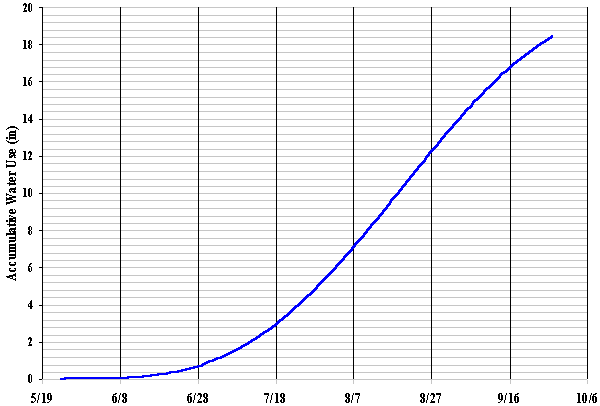
The same data can be graphed as accumulative water use as shown in this graph by stacking daily water use (ipd) from emergence to crop termination. As before, 18.8 inches is the total. This is the basis of a Woodruff chart.
[ Contact Joe Henggeler for Questions/Comments ]
[ Woodruff Instructions and Background Information ] [ AgEBB ]